Dashboards & BI Module
Turn Operational Data into Actionable Insights
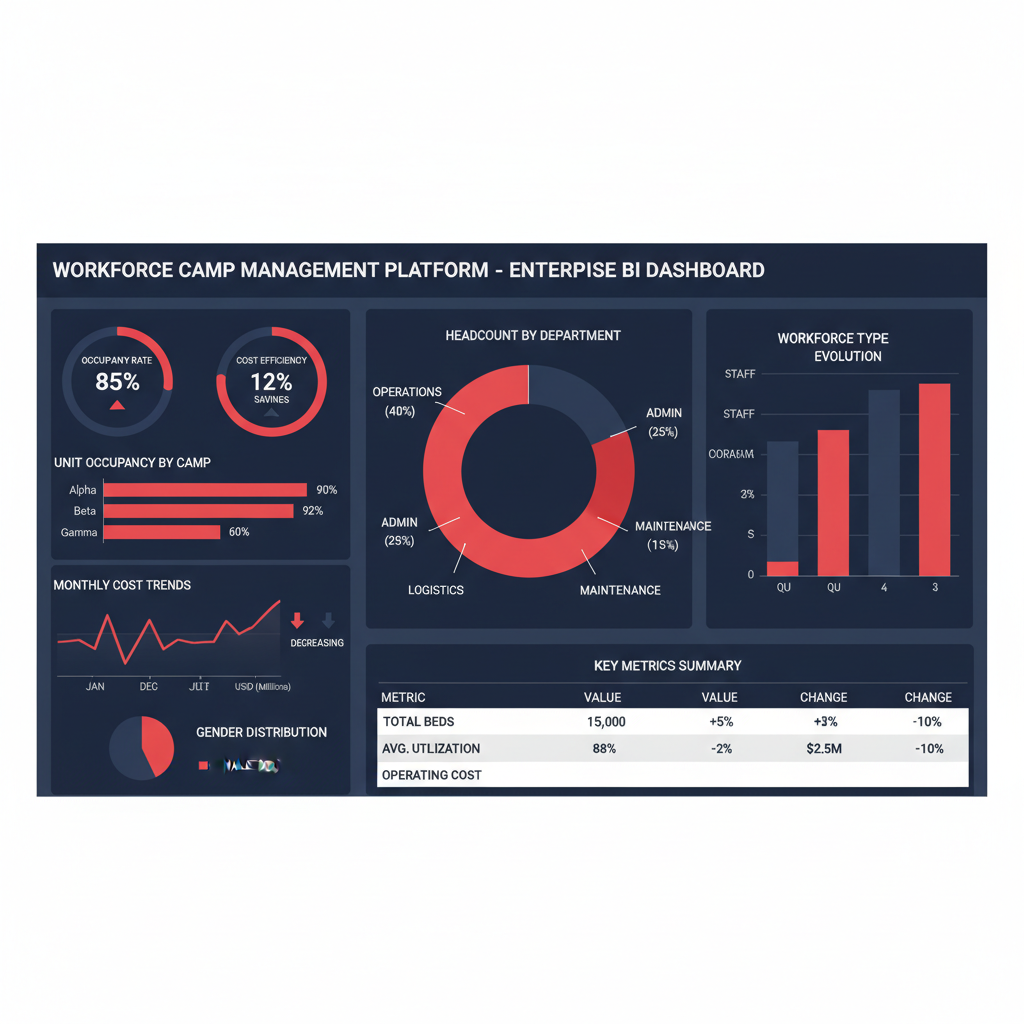
The Dashboard and Business Intelligence module provides real-time information across accommodation, employees, transportation, meals, housekeeping, maintenance, assets, contracts, and finance.
Business Challenges
Problems We Solve
Data Silos
Operational data is scattered across departments and systems.
Delayed Reporting
Manual report preparation takes days instead of minutes.
No Executive Visibility
Leadership lacks a real-time view of operations.
Features
Everything You Need for Operational Intelligence
Executive dashboard
Occupancy and vacancy analytics
Employee distribution
Meal consumption analytics
Transportation performance
Maintenance status
Housekeeping productivity
Contract utilization
Revenue and cost reports
Custom report builder
Export to Excel and PDF
Power BI integration
Scheduled reports
Role-based dashboards
Benefits
Why Teams Choose Camp Master
Improve management visibility
Support faster decision-making
Identify operational risks
Monitor performance indicators
Reduce manual report preparation
Provide accurate information to clients
How It Works
Intelligence Workflow
Data Collected
Processed in Real-Time
Dashboards Updated
Reports Scheduled
Insights Delivered
Reporting
Dashboard & Reporting Capabilities
- Executive KPI summary
- Occupancy trends
- Cost per employee
- Revenue by contract
- Operational efficiency scores
- Scheduled automated reports
Real-Time
Data Updates
14+
Report Types
Power BI
Integration
Auto
Scheduled Reports
Integrations
Works Seamlessly With
Ready to Transform Your Operations?
Give your leadership team the real-time visibility they need to make confident decisions.